Members Login Book a Free Demo
Book a Free Demo

How We Help Your Child Feel More Confident with Statistics & Probability

Statistics and probability help children make sense of information, recognise patterns and understand how likely something is to happen.

These skills develop gradually. Children begin by collecting and sorting information, reading simple tables and graphs, and using everyday language such as impossible, unlikely, likely and certain. As they progress, they learn to compare data, interpret more detailed graphs, calculate averages and use probability to make predictions.

Because each new skill builds on earlier learning, gaps in number knowledge, reading scales or comparing values can make later work feel more difficult. Strengthening these foundations helps your child understand information more clearly, explain their thinking and approach statistics and probability with greater confidence.

Assessment first

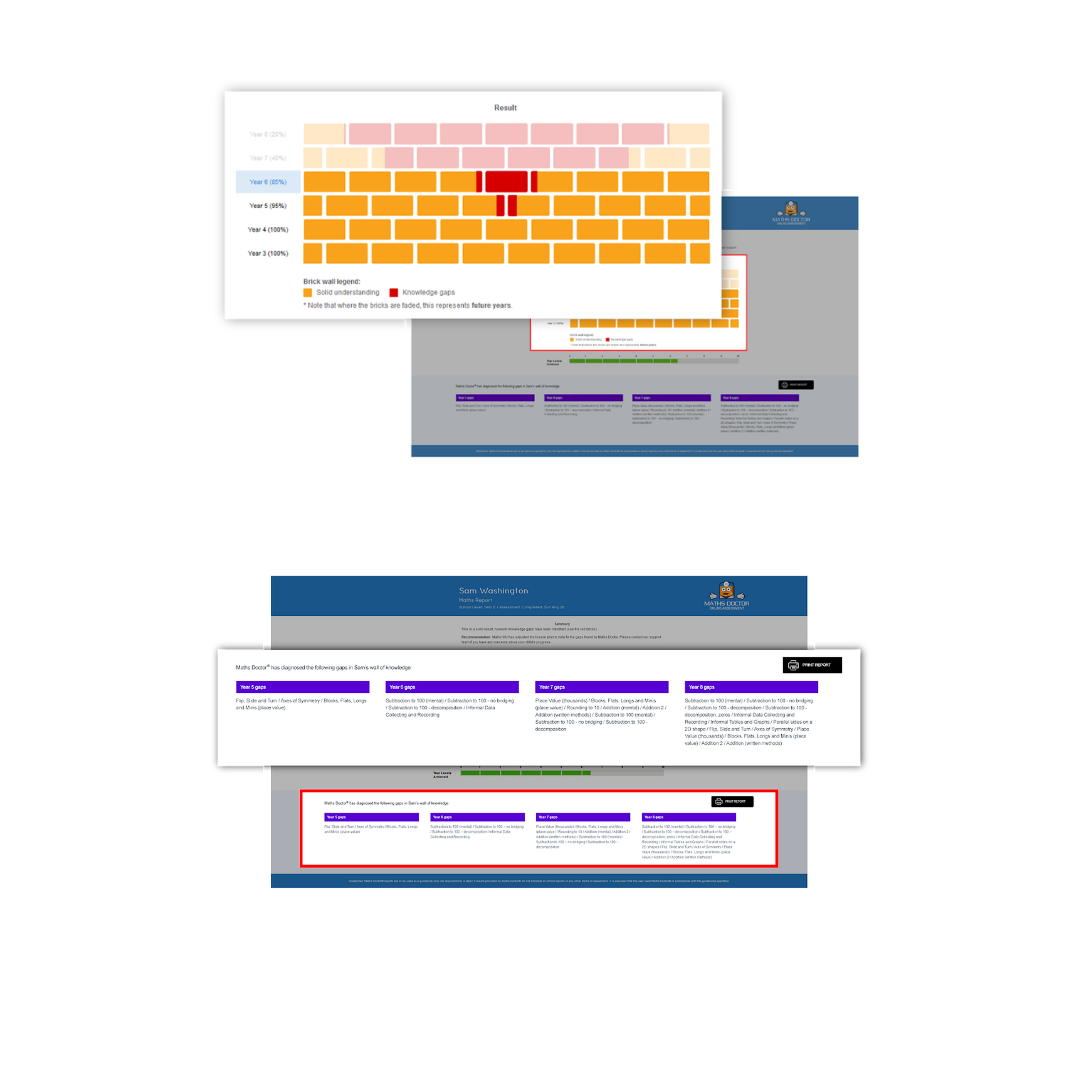
We start with an assessment to understand your child’s current maths level, identify any gaps in understanding across multiple year levels of the Australian Curriculum, and see where they are ready to move ahead. From there, we create a personalised weekly learning plan tailored to their needs.

Personalised Learning Plans

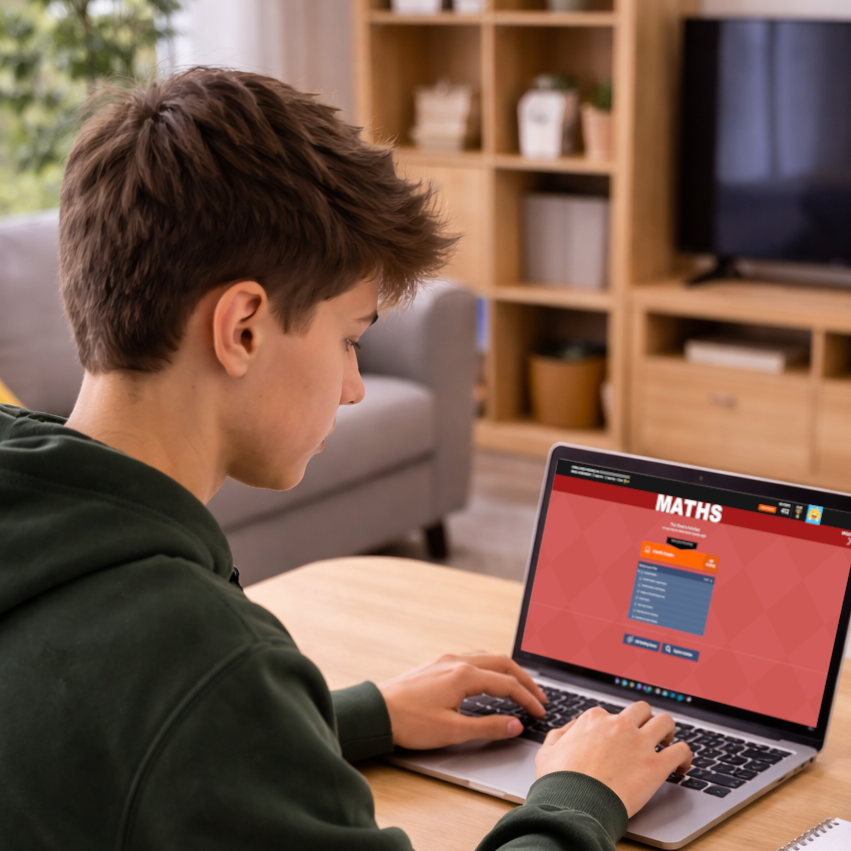
Your child’s personalised learning plan is delivered weekly and can be completed at home on a tablet or computer. Each Monday, new 20-minute maths lessons are added based on your child’s progress, helping keep learning at the right level and supporting a consistent learning routine.

Proven Progress

As your child strengthens their foundations, you’ll see them build skills and confidence in maths, and keep moving forward at a pace that feels right for them.

Expert Tutors Available

If your child needs extra support, our online maths tutors are there to explain concepts further and answer questions, so your child can continue with confidence.

Statistics and Probability: What’s Covered and How We Help

Statistics and probability help children make sense of information, recognise patterns and understand how likely something is to happen. These skills develop gradually as children move through the Australian Curriculum.

Children begin by collecting and sorting information, reading simple tables and graphs, and using everyday language such as impossible, unlikely, likely and certain. As they progress, they learn to compare data, interpret more detailed graphs, calculate averages and use probability to make predictions.

Because each new skill builds on earlier learning, we begin with an assessment to identify any gaps and create a personalised learning plan from the right level for your child.

Year Level
What the Curriculum Covers
How Kinetic Helps
Foundation – Year 2
Children begin by collecting, sorting and answering simple questions with data. They create basic picture graphs and use everyday words like likely and unlikely to describe chance.
We use sorting activities and simple picture graphs so your child can see what data is telling them. We also build their understanding of chance through familiar, everyday examples.
Year 3 – Year 4
Children collect data, organise it in tables and column graphs, and explain what the data shows. They also describe and order chance events and begin listing possible outcomes.
We help your child organise information into tables and graphs, then understand and explain what the data shows. They also practise listing possible outcomes and ordering events by how likely they are to happen.
Year 5 – Year 6
Children work with data displays such as dot plots and column graphs, and describe what the information shows. They also begin describing probability using fractions, decimals and expected outcomes.
We help your child connect probability with fractions and decimals, while building confidence reading dot plots, column graphs and other data displays. If earlier number skills need strengthening, these can be included in their learning plan.
Year 7 – Year 8
Students calculate mean, median, mode and range, compare data sets and learn about sampling. In probability, they work with complementary events, two-step chance experiments and two-way tables.
We build mean, median, mode and range on the number skills they rely on, then help your child work through comparing data sets, sampling, complementary events and two-way tables step by step.
Year 9 – Year 10
Students compare the spread of data sets, consider sampling and bias, and work with scatter plots. Probability also extends to relative frequency, conditional probability and tree diagrams.
We help your child interpret spread, sampling and bias, then work through scatter plots, relative frequency, conditional probability and tree diagrams. Any earlier gaps affecting their progress can be strengthened alongside these skills.

Trusted by Thousands of Happy Families  

Skip to end of cards

Melanie

After years of struggling with maths, Melanie’s daughter boosted her grades and confidence in just a few months with Kinetic Education. She has made so much progress that her new teacher didn’t even realise she had struggled with maths in the past.

Louise

Louise’s daughters started the school year feeling anxious to go to class, worried they wouldn’t understand maths concepts. But in just 4 months, their confidence has grown, and they are now happy to go to maths classes at school. Not only this, but their school reports and grades have boosted, but most importantly their confidence has too!

Rosie

Rosie came to Kinetic Education looking for support for her two children, who both needed completely different support. Her daughter was really struggling with maths, and homework time was always stressful, while her son was one step ahead at school and starting to feel bored. With support from us, Rosie’s daughter is now able to work through new concepts confidently, and her son gets the challenges he needs to stay one step ahead.

Maths Tutoring Starts with Identifying Your Child’s Level

When your child gets started with Kinetic Education, their first step is completing our Maths Doctor assessment. This checks their maths skills across multiple year levels of the Australian Curriculum, including the number knowledge, graphing, data and probability skills that support this area of learning.

The assessment helps us understand their current skills, identify any earlier gaps that may be making statistics and probability more difficult, and see where they are ready to move ahead.

It takes up to 45 minutes and gives us a clear starting point for your child’s personalised weekly learning plan. From there, we can strengthen the right foundations while helping them continue working through the curriculum at a pace that suits them.

Personalised learning

At Kinetic, statistics and probability run through your child's personalised learning plan from the very beginning, as part of a complete maths program aligned to the Australian Curriculum. Here is how it works:

Every Monday, we update your child’s learning plan with new maths activities for the week, selected around their assessment results and progress. Their learning plan moves through three stages: Revision and Catch-Up, Consolidation, and Extension.


Skip to end of cards

Revision and Catch-Up

When your child first starts with Kinetic Education, their learning plan targets the knowledge gaps identified in their assessment. This may mean revisiting earlier skills such as sorting information, reading scales, interpreting simple graphs or understanding the number skills used in probability before moving into more complex work.

Consolidation

As your child builds their understanding, their learning plan continues to reinforce the skills they are currently working on. Regular practice helps them use maths skills across the curriculum, including reading graphs, comparing data, working with averages and understanding probability, with more confidence and apply what they have learned to different types of questions.

Extension

When your child is ready to move ahead, their learning plan introduces more challenging maths across the curriculum, including statistics and probability. This may include comparing data sets, working with averages, interpreting scatter plots, exploring sampling and bias, and solving more complex probability questions. This helps them extend their understanding and apply their skills to unfamiliar and real-world problems.

Personalised Learning with Real Tutor Support

Our interactive lessons break each idea into clear steps using pictures, animations, text and audio, covering everything from simple picture graphs in the early years through to probability and data analysis in Year 10. When something isn't clicking, your child's tutor can walk through any problem in real time using screen sharing and a digital whiteboard. Tutor support is available after school, Monday to Thursday, up to 10 hours per week, at no extra cost.

Parent support: You do not have to wonder how your child is going. Each week you receive a report on what they have worked on and how they are progressing, and you can call the Parent Helpline to speak directly with their tutor.


Trusted by 100,000+ Australian Families

Rewards

Every activity your child completes earns points they can save and swap for real rewards, including Smiggle, Myer and WISH gift cards. That extra bit of motivation helps keep learning steady, especially for children who have found maths hard.

Pricing

Statistics and probability are included as part of Kinetic Education’s maths support. Starting from $29 per week for the family, Kinetic Education includes the full Australian Curriculum assessment, a personalised weekly learning plan, access to all lessons and activities, tutor support up to 10 hours per week, weekly progress reports and the Parent Helpline. New families receive their first two weeks free.

FAQs

What is the difference between statistics and probability?

Statistics is about collecting, showing and reading data, such as making and interpreting graphs. Probability is about how likely something is to happen, measured on a scale from impossible to certain. Children learn both from the early years of primary schoo

My child can make a graph but can't answer questions about it. Why? 

Reading a graph is a different skill to making one. It means noticing the scale, comparing values and drawing a fair conclusion. Our lessons focus on interpreting data, not just creating it, so your child can answer the questions that follow.

When do children start learning probability?

Children start describing chance in the early years using words like "likely" and "unlikely". From around Year 5 and 6 they begin putting numbers to it, using fractions and decimals, and it becomes more detailed through high school.

How are statistics and probability taught in the lessons? 

Through interactive lessons that use clear visuals and a mix of question types with instant feedback, so reading data and understanding chance feel approachable. Tutors are available to talk through anything that isn't clicking.

How much does it cost? 

Kinetic's maths support covers statistics and probability alongside the other key areas of the Australian maths curriculum. It starts from $29 per week for the family, and your first two weeks are free.

Can I speak to someone about my child's specific needs before getting started? 

Yes. When you book your free demonstration, we’ll chat about how your child is currently going with their learning, what they’re finding difficult and how Kinetic Education could support them.

Get Your First 2 Weeks Free

Start today with your free demonstration

  • Personalised lessons in Maths & English
  • Live Australian tutors
  • Fun rewards to keep kids motivated as they learn
  • From just $29/wk for the family*

Limited Spots

* By entering your details, you give Kinetic Education permission to contact you to discuss its tutoring via phone and/or email and record such communication for training and compliance purposes. You understand that the 2 weeks free tutoring is only available to children that have not previously received any free tutoring from Kinetic Education.